U.S. hotel occupancy inched up week to week, but is still lower than a year ago, while outside of the U.S., that trend is reversed.
Rising occupancies in global markets outside the U.S. are partially at the expense of U.S. markets, as the world opens up to travelers who have previously been limited in their destinations. But the bigger trend behind the performance data is a normalization and rebalancing of travel demand following a post-pandemic surge in leisure travel.
In the U.S., hotel industry occupancy increased 0.9 percentage points week over week to 68.5% but was down 1.6 percentage points versus last year, CoStar data shows.

The year-over-year softness was somewhat surprising given that the week had the most schools out of session for fall break according to STR’s School Break Report, and it included the Columbus Day/Indigenous Peoples’ Day holiday. Occupancy for the three-day weekend was 71.8%, 1.9 percentage points lower than a year ago. The highest occupancy for this holiday weekend was 74.9% in 2017.
U.S. average daily rate rose 3.2% year over year, holding above 3% for a fourth consecutive week and close to the rate of inflation. Revenue per available room increased 0.8% year over year, with the occupancy decline offsetting the ADR gains.
Global occupancy, excluding the U.S, fell slightly, down 0.6 percentage points to 68.9%, but was 6.1 percentage points higher than the same week last year. ADR decreased 8% week over week to $148, but was up 14.2% year over year. RevPAR grew 25.2% year over year to $102.
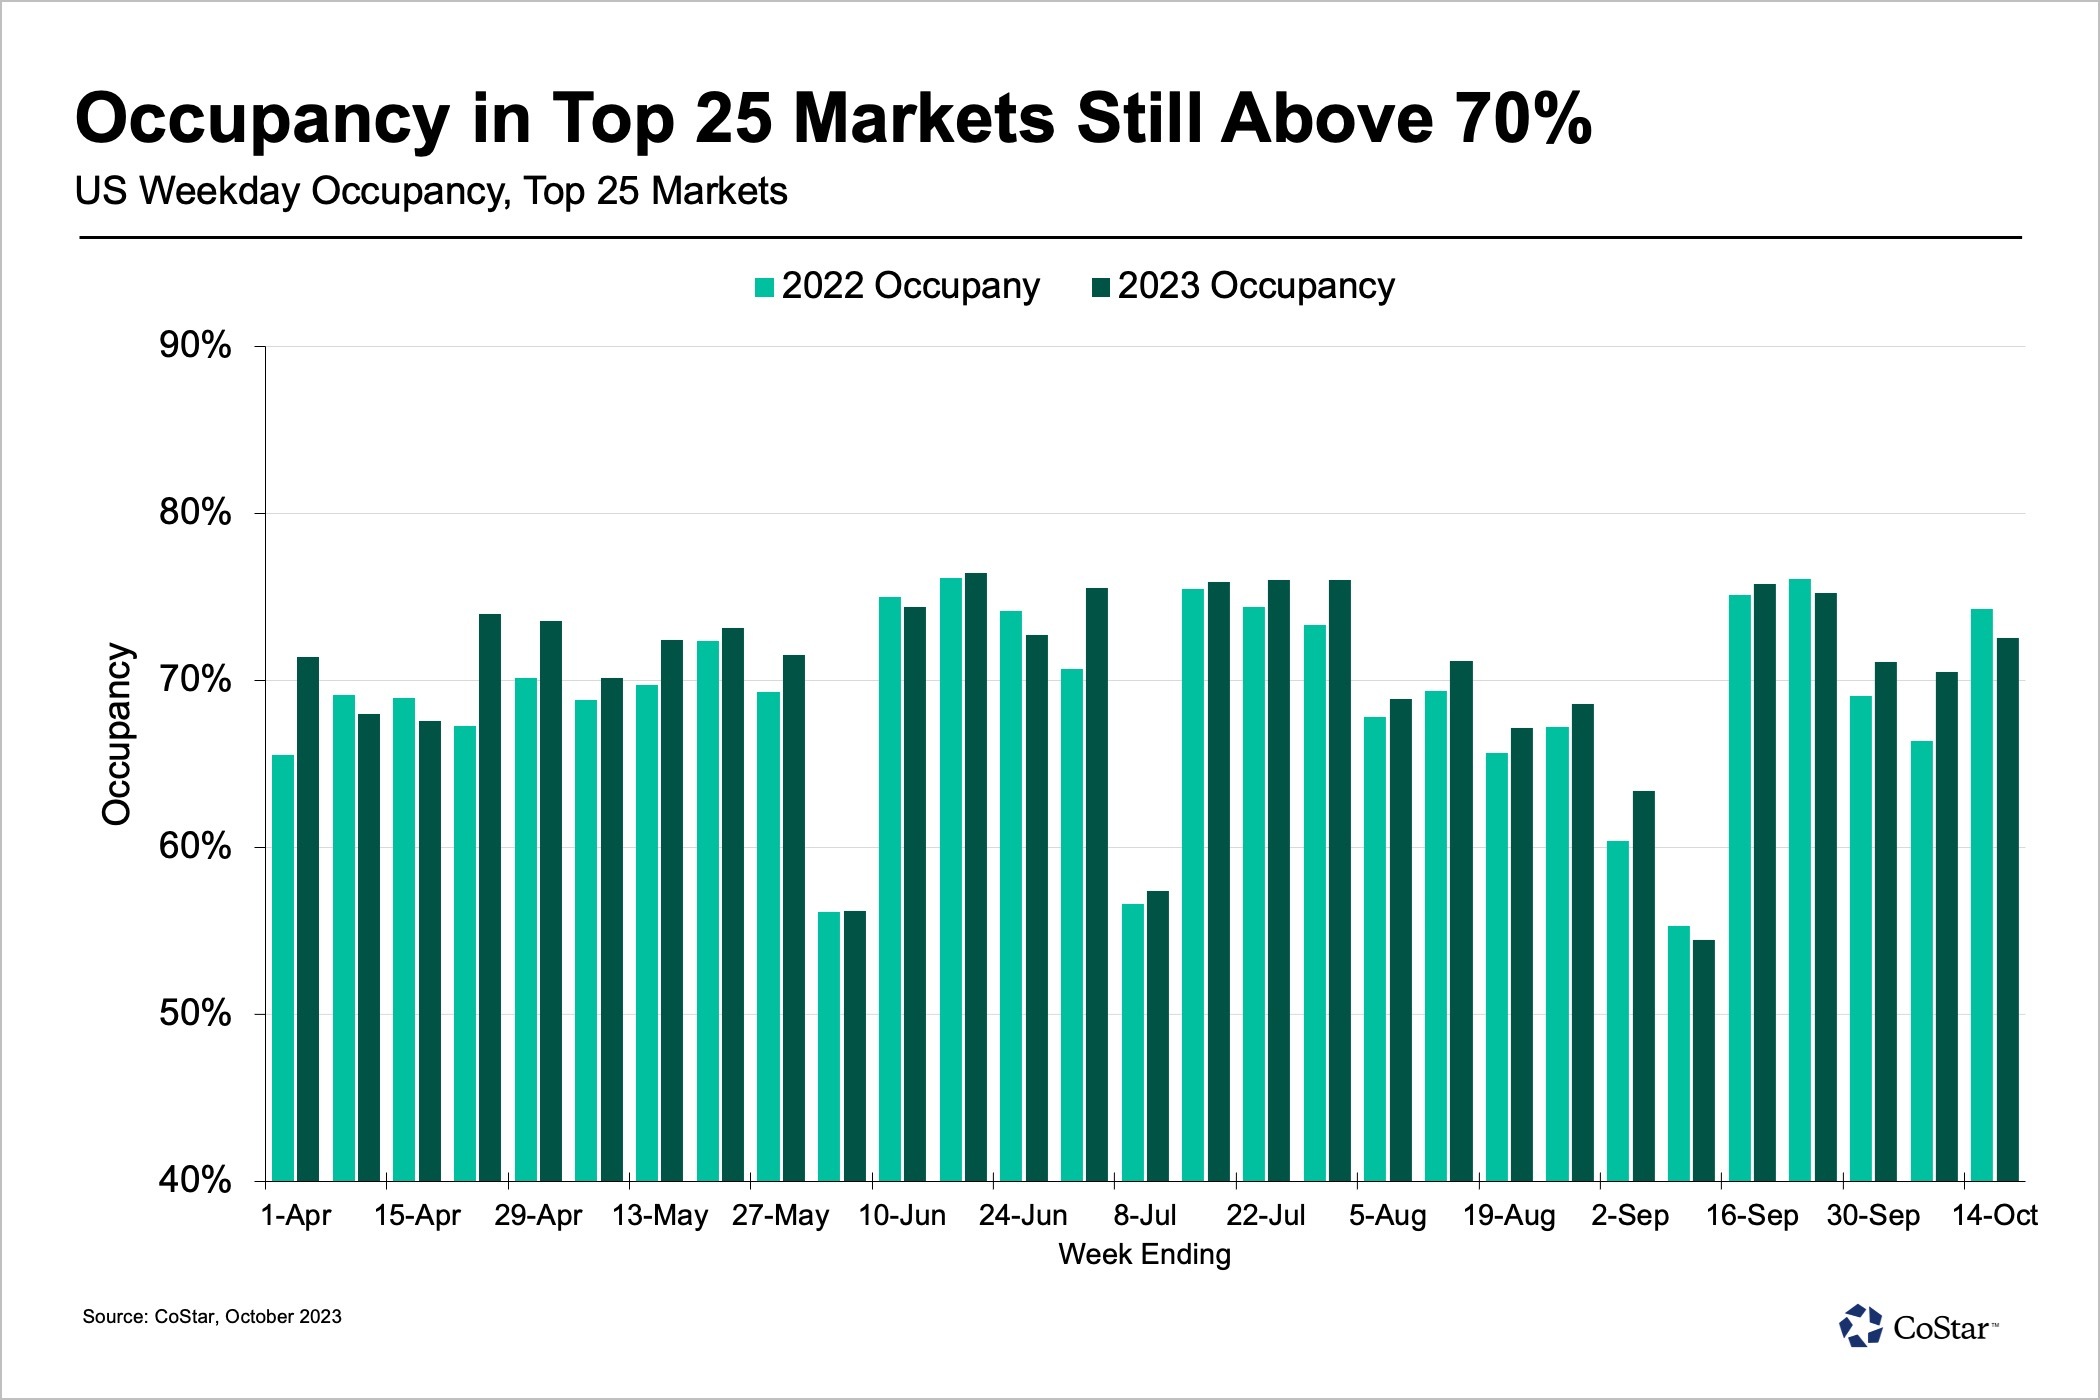
Occupancy in the top 25 U.S. markets fell 1.6 percentage points week over week to 74%, and was down 1.9 percentage points from a year ago. Even with the week-over-week decrease, this was the group’s fifth week with occupancy above 70%. Compared to last year, occupancy increased in only eight of the top 25 markets. Still, ADR increased 3% year over year and RevPAR was up 0.4%.

Top 25 markets posting the largest year-over-year group occupancy increases over the past four weeks are Boston (+5.1 percentage points), Philadelphia (+4.6 percentage points), Chicago (+4.1 percentage points), Oahu (+3.9 percentage points), Washington, D.C (+3.0 percentage points), and Minneapolis (+2.9 percentage points).
- Boston had the highest occupancy of the top 25 at 88.3%, up 3.8 percentage points year over year. RevPAR increased 18.5%, driven by a strong weekend.
- Las Vegas hotel occupancy was 88.1%, up 4.7 percentage points. RevPAR increased 21.1%.
- Occupancy in Oahu reached 85.2%, up 12.8 percentage points. Shoulder (Sunday and Thursday) and weekday RevPAR was up 31.7% and 39.7%, respectively.
- New York City had the nation’s fourth-highest occupancy at 88%, but it also was down compared to last year. New York RevPAR for the week increased 7.3% year over year.
- Outside of the top 25 markets, five markets posted occupancy above 80% including Gatlinburg, Tennessee, (91.3%), which had the nation’s highest occupancy this week.
Among the top 10 countries based on supply, occupancy was flat week over week at 70.3%, but increased year over year by 9.1 percentage points. ADR for the same countries was down $17 week over week to $139, but up 12.2% year over year. Overall, top 10 RevPAR was up 28.9% year over year to $97.

The largest year-over-year gain in occupancy occurred in China, where the metric was up 17.3 percentage points to 63.5% for the week. Strict COVID measures were still in place across China this time last year, particularly in Beijing ahead of the national party conference. As a result, along with strong ADR improvements, China had the highest RevPAR growth of the top 10 at 72.7%, followed very closely by Japan at 72.2%. Conversely, the United Kingdom had the highest occupancy out of the top 10 this week at 81.9%, up 0.6 percentage points, and RevPAR increased 8.9%.
Isaac Collazo is vice president of analytics at STR. Chris Klauda is senior director of market insights at STR. William Anns is a research analyst at STR.
This article represents an interpretation of data collected by CoStar’s hospitality analytics firm, STR. Please feel free to contact an editor with any questions or concerns. For more analysis of STR data, visit the data insights blog on STR.com.
Read more news at Hotel News Now.